Home
Technical Specifications
Examples
- Geotechnical
People
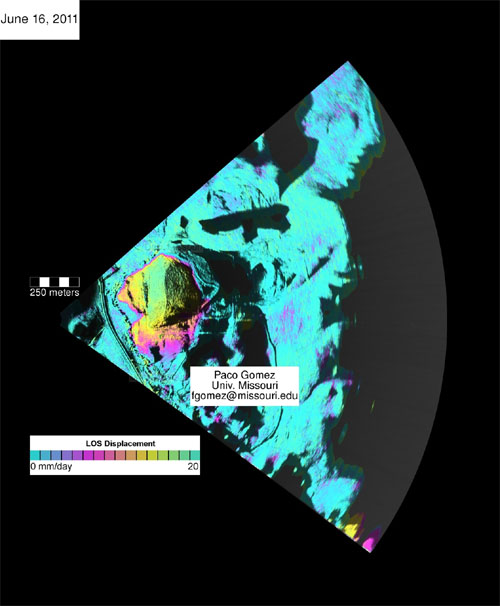 The GBIR has been
used to image
a moderate-velocity (~cm/day) landslide near the Front Range
in
north-central Colorado. The example at left shows a
displacement
image based on a 5-hour observation session with scans every
7.5
minutes. In total, 380 interferograms were analyzed
providing
ample data for inverting a time series.
The GBIR has been
used to image
a moderate-velocity (~cm/day) landslide near the Front Range
in
north-central Colorado. The example at left shows a
displacement
image based on a 5-hour observation session with scans every
7.5
minutes. In total, 380 interferograms were analyzed
providing
ample data for inverting a time series.For this site, interferograms are based on data acquired during a single observation session.
More details are reported by a Lowry et al. (Engineering Geology, 2013).
Example: Helheim Glacier (SE Greenland)
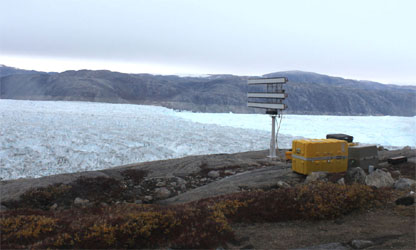 In collaboration with
researchers from the University of Kansas, University of
Maine, and the
Cold Regions Research and Engineering Laboratory, the GBIR
was used to
image ice and melange movement at the terminus of the
Helheim Glacier
(SE Greenland).
In collaboration with
researchers from the University of Kansas, University of
Maine, and the
Cold Regions Research and Engineering Laboratory, the GBIR
was used to
image ice and melange movement at the terminus of the
Helheim Glacier
(SE Greenland). 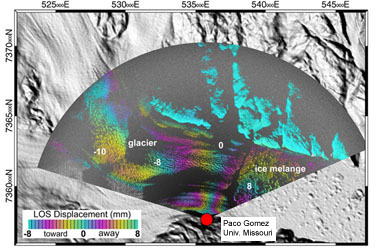
Owing to the rapid ice velocity (~cm/minute), images were acquired every minute over a ~48-hour period (Ku-band during the first 24 hours; C-band during the remaining time).
The average, 1-minute Line-of-Sight rate from the Ku-band data is shown at left. These results are part of the undergraduate thesis of Howard Loftis at MU.
Example: Landslide in the Bighorn Mountains, Wyoming
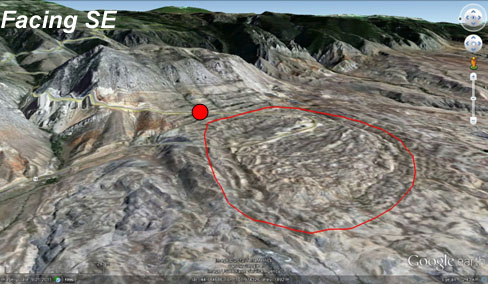
 A slow-moving landslide
(~cm/month) is being studied as
part of Bjorn Held's graduate research. The slide is
located in
the Bighorn Mountains (Wyoming) along Highway 14-Alt.
In the
oblique view at right, the red dot denotes the radar's
viewing point.
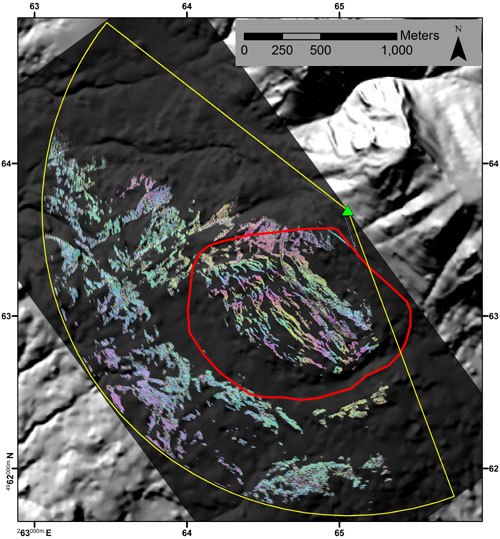
A slow-moving landslide
(~cm/month) is being studied as
part of Bjorn Held's graduate research. The slide is
located in
the Bighorn Mountains (Wyoming) along Highway 14-Alt.
In the
oblique view at right, the red dot denotes the radar's
viewing point.For this study, the GBIR has been used in in repeated setups ('repeat-pass'). Care is taken to insure the radar position is precisely repeated to insure a zero-baseline interferogram. Multiple scans are made during each session to provide redundant images and improve the interferometric coherence.
The example at the right shows the resulting displacement phase (1 cycle = 0.8 mm in the line-of-sight) over a two-month span. Atmospheric phase has been modeled and removed using meteorological data.
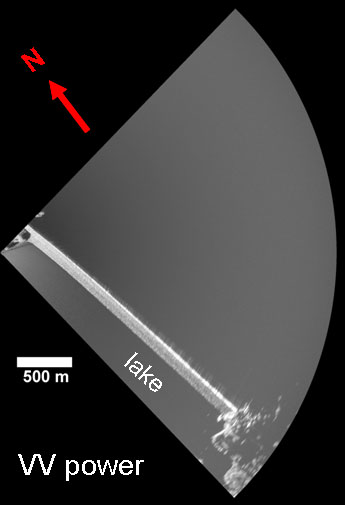
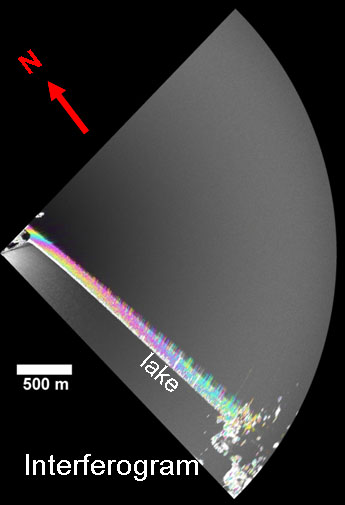
Example: Small deformation of a dam in Kansas
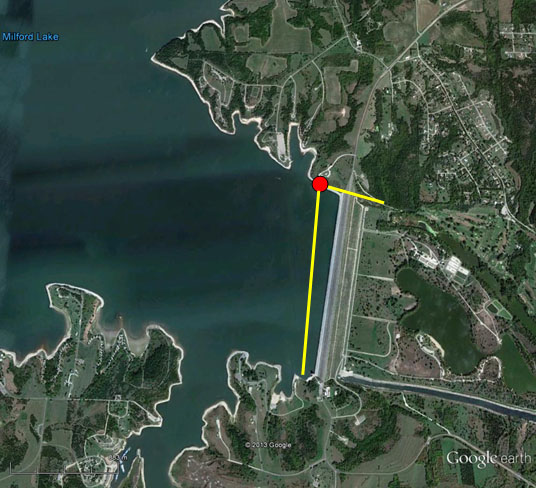
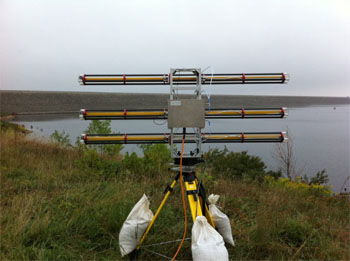
Repeat-setup surveying has been applied to civil structures, too. The example shown here images the back side (i.e., lake side) of the dam at the Milford Reservoir in Kansas. The rip rap face maintains coherence over time (red dot denotes the viewing point for the images shown below). Owing to the viewing geometry, the obliquity of the line-of-sight relative to the dam varies along the scan line. A residual phase anomaly in the interferogram below may reflect the response to loading that results from changes in lake level. (Research is part of Wyatt Jenkins's M.S. thesis research at MU.)
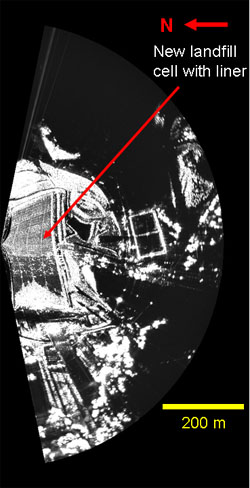
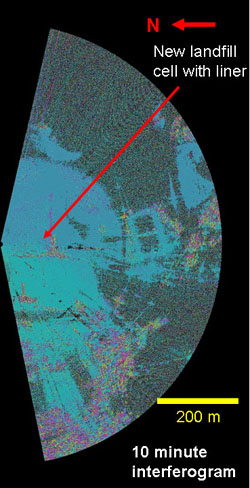
Example: Deformation of a landfill liner
 A single-setup
survey was performed on a
newly install liner for the Columbia, MO, landfill.
A single-setup
survey was performed on a
newly install liner for the Columbia, MO, landfill. After being placed into a new landfill cell, the liner will expand and deform as it heats during the day. Landfill engineers are concerned about the liner folding over itself as it deforms and, thus, compromising its integrity.
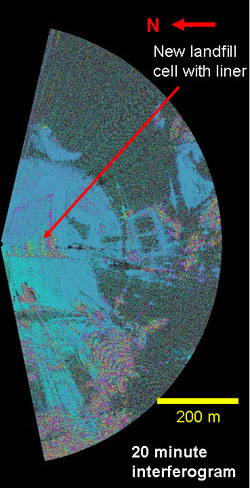
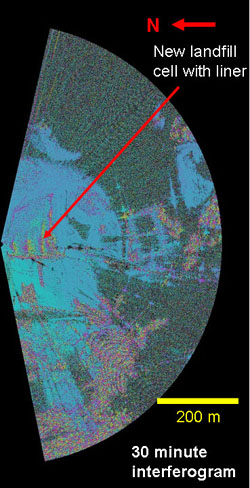
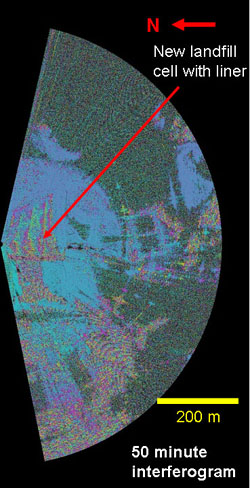
Images were acquired every 10 minutes after the liner was installed. Example interferograms are shown below. The propagating zones of deformation within the liner can be observed to follow the seams between sections of liner.
The GBIR can map strain zones in a freshly installed landfill liner – in principle, this can be documented in near real time.
(Research is part of Wyatt Jenkins's M.S. thesis research at MU.
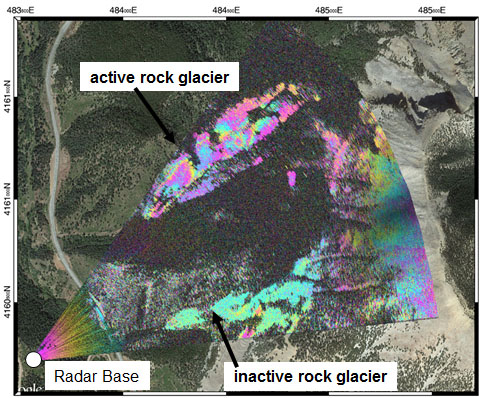
Example: Rock glacier (Rocky Mountains)
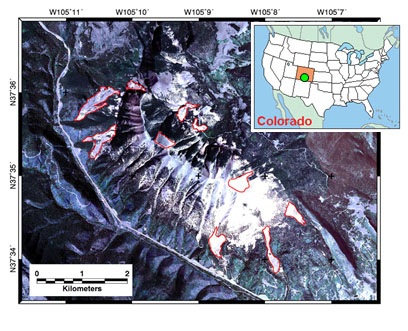
Numerous rock glaciers (red outlines) move rock debris down the slopes of Mt. Mestas (Spanish Peaks region, southern Colorado).
GBIR
interferogram
spanning ~6 weeks (June 11 – July 24, 2014)
distinguishes active and inactive
rock glaciers. Displacements during this time
exceeded 1 cm in the radar's line-of-sight (more than
one cycle of phase).